Now, be part of the solution instead of the poor data quality problem!
Take our Poor Data Quality Survey at the InfoGov Community site. If you are a member of the InfoGov Community, logging in will trigger the survey. If you are not yet a member, visit the site, join, and take the survey. There is no cost to join the InfoGov community, and many benefits.
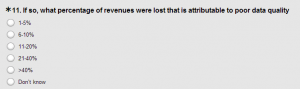
Our poor data quality survey is designed to make it easy for respondents to identify data related problems by business functional areas (e.g. Sales, Marketing, Finance, HR), and to select causes (e.g. missing data, stale data, naming issues, silo restrictions) of the poor business outcomes from poor data quality. Most importantly, our survey respondents will be able to monetize the effects of data quality problems.
What is in the Poor Data Quality survey?
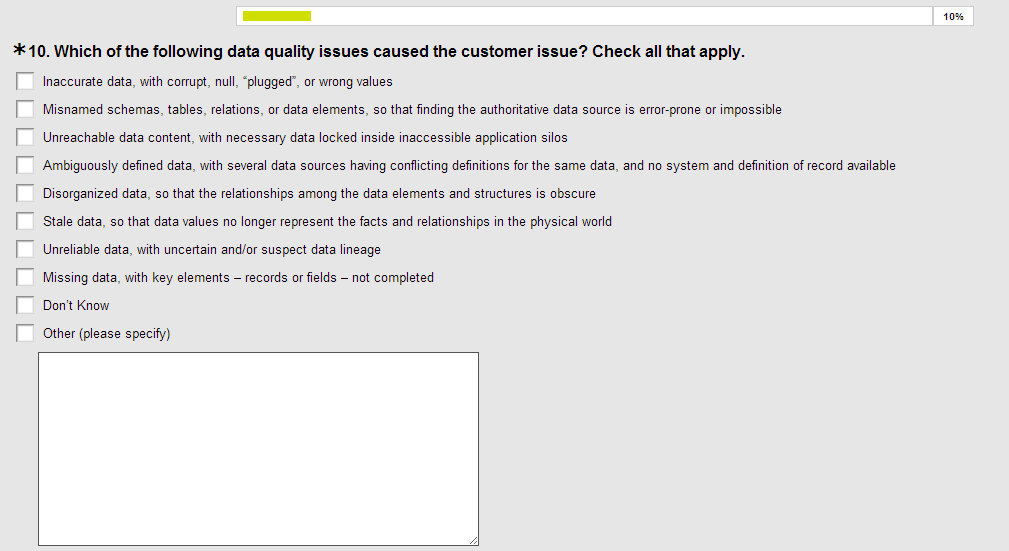
This is a two-part survey. In part one, we cover the functional areas of business, asking respondents to identify and monetize problems in any of these areas for which they have experience and insight.
Did you experience or are you aware of these problems due to poor data quality?
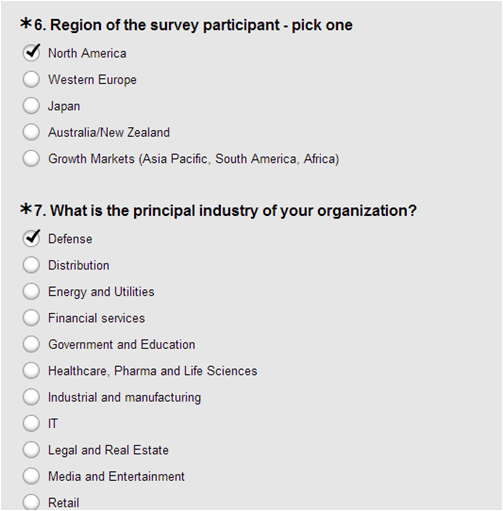
What about Demographics?
Naturally, we want to analyze the survey results by respondent role, reporting relationship, industry, geographic area, and company size. Respondents answer with the click of a radio button as a clip from the survey shows, following.
What will we do with all the data?
Analyze it, and publish our findings. By the way, we plan to close the survey at the end of this calendar year, and then run it annually and publish additional reports.
Survey results in different flavors will be available for purchase after we publish. Individual purchasers will receive a .pdf or an online view of results. Corporate clients will receive comprehensive analyses of results, graphical presentations, and interviews. Technology vendors may opt to receive the detailed data tabulations in addition to our standard corporate deliverable package.
We will also offer custom client surveys. We’ll run this survey specifically for your organization and compile the results for your organization’s consumption only. The general survey results will provide a baseline from which your organization can measure its successes and challenges.
Please do contact us here, for specifics on pricing and deliverables.
Success has many fathers…
I have written in this blog, here, here, here, and here, about the poor data quality survey while it was under development, in conjunction with The Robert Frances Group, Chaordix, and the InfoGov Community. Well, launch has occurred this morning and our survey is now in flight. Let me thank Cal Braunstein, CEO of The Robert Francis Group, Todd Courtnage, Director of Cloud Computing for Chaordix, Joe Royer of Principal Financial, a motivated InfoGov member, and Steven Adler of IBM, head of the Information Governance Community, for all the hard work that made our survey launch possible today.
The Bottom Line
The information we gather, analyze, and publish as a result of this survey will help organizations justify investing in improving their data quality. Better data quality means better business outcomes for all of us. Please do help us make a difference by taking the poor data quality survey today!